Surface Site Validation
Release 4-IP shortwave and longwave downward surface fluxes have been validated against the Baseline Surface Radiation Network (BSRN) data and the Pacific Marine Environmental Laboratory (PMEL) buoy data. At this time, there are 12,116 site-months of BSRN data from 73 sites and 6235 buoy-months of PMEL from 64 buoys.
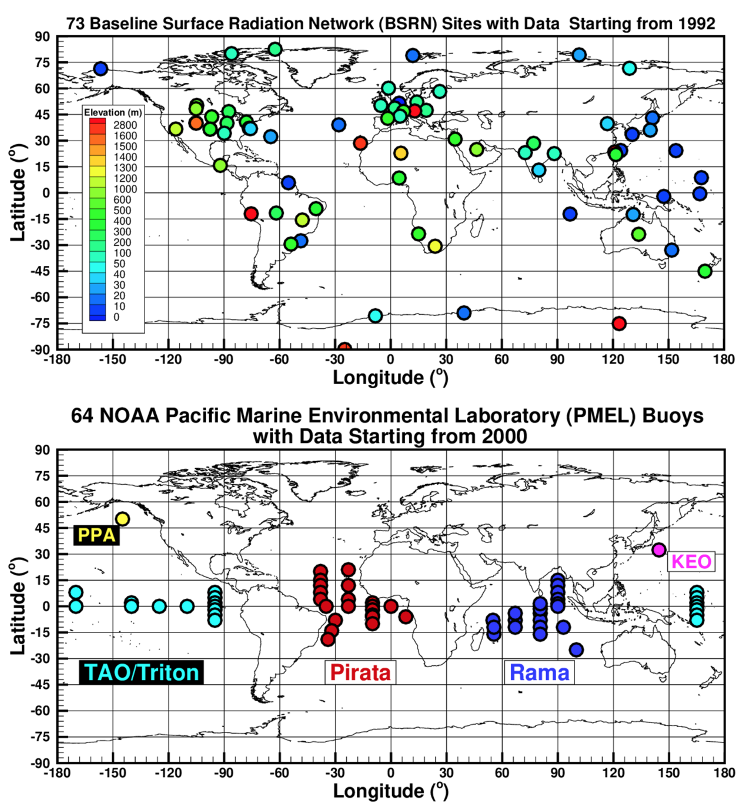
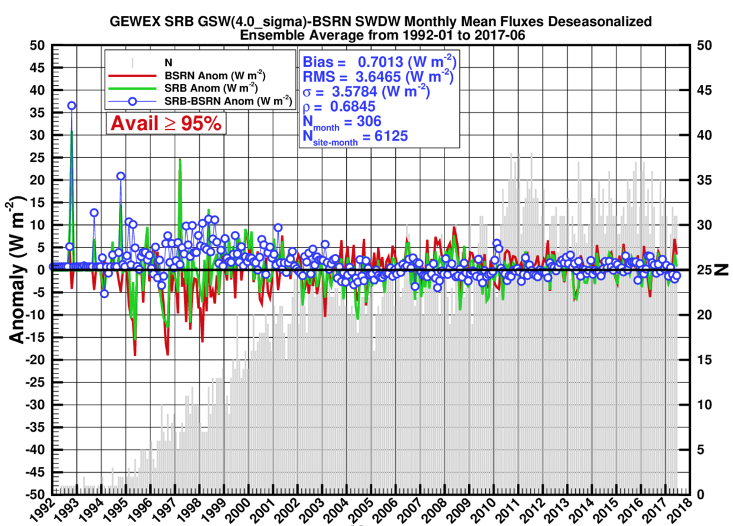
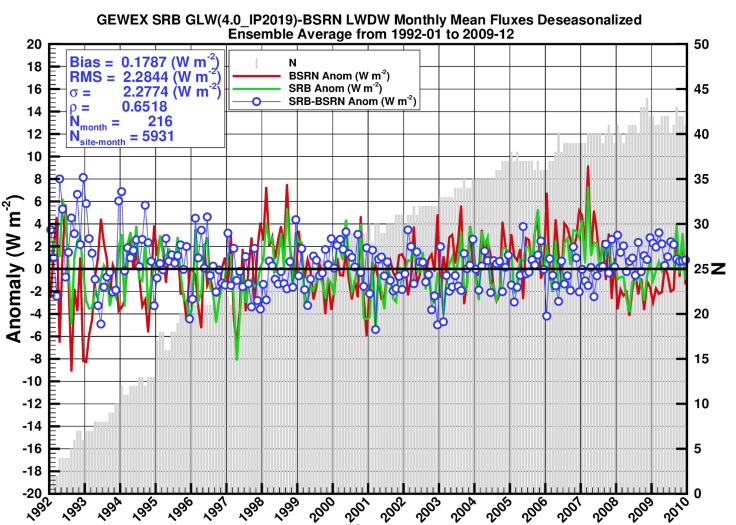
BSRN
The original BSRN data are 1-, 2-, 3- or 5-minute intervals. Quality-control is first performed on the original data to remove records deemed bad, and then 3-hourly, daily and monthly means are calculated. Note that shortwave 3-hourly validations include only daytime values, which is why their biases are roughly two times larger than their daily and monthly counterparts which, by definition, include nighttime, or zero, values.
| Shortwave (January 1992 – June 2017) | ||||||
|---|---|---|---|---|---|---|
| Time Ave | Bias | RMS | ρ | σ | μSRB | Number |
| 3-hourly | -2.9 | 77.6 | 0.96 | 77.5 | 285.4 | 1280023 |
| Daily | 1.3 | 28.1 | 0.97 | 28.1 | 170.5 | 154459 |
| 3-hourly monthly | -1.1 | 24.2 | 1.0 | 24.2 | 139.7 | 62108 |
| Monthly | -1.0 | 14.7 | 0.99 | 14.7 | 170.1 | 6097 |
| Longwave (January 1992 – December 2009) | ||||||
|---|---|---|---|---|---|---|
| Time Ave | Bias | RMS | ρ | σ | μSRB | Number |
| 3-hourly | 1.8 | 32.7 | 0.91 | 32.7 | 316.0 | 1307985 |
| Daily | 1.5 | 25.2 | 0.94 | 25.1 | 317.3 | 156069 |
| 3-hourly monthly | 0.4 | 19.0 | 0.97 | 19.0 | 311.0 | 46962 |
| Monthly | 0.9 | 15.9 | 0.98 | 15.9 | 311.0 | 5835 |
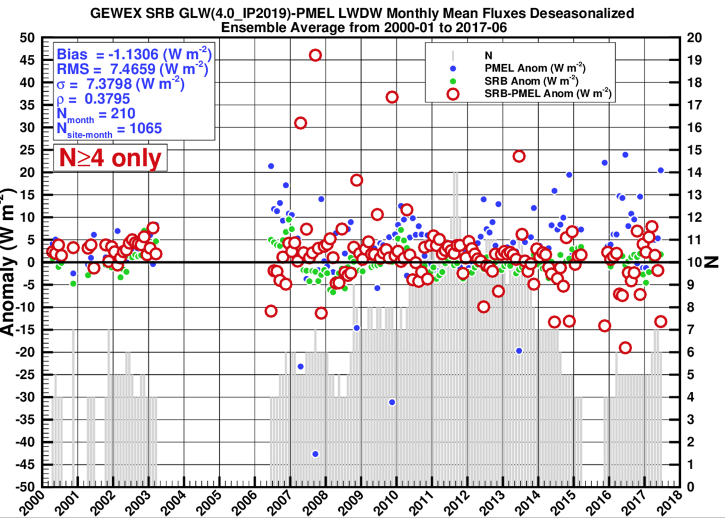
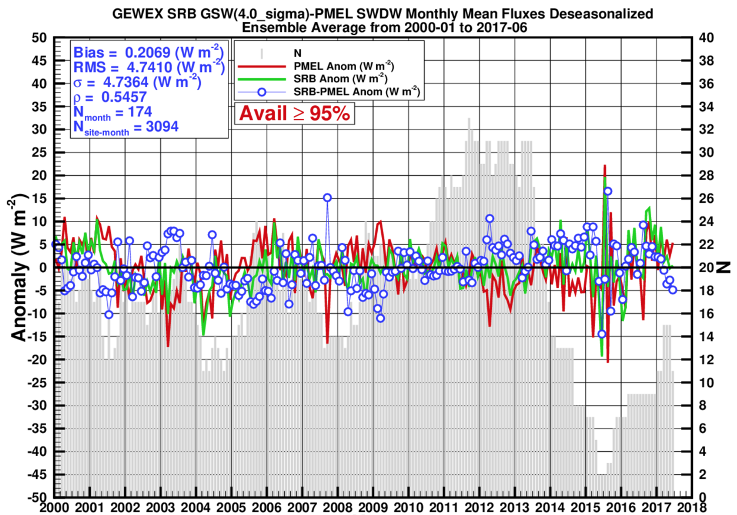
PMEL
| Shortwave (January 2000 – June 2017) | ||||||
|---|---|---|---|---|---|---|
| Time Ave | Bias | RMS | ρ | σ | μSRB | Number |
| 3-hourly | 4.9 | 95.0 | 0.96 | 94.9 | 381.0 | 648515 |
| Daily | 3.1 | 34.6 | 0.86 | 34.4 | 236.3 | 126578 |
| 3-hourly monthly | 2.8 | 28.3 | 1.0 | 28.2 | 231.2 | 32159 |
| Monthly | 2.9 | 13.9 | 0.95 | 13.6 | 134.8 | 4158 |
| Longwave (January 2000 – June 2017) | ||||||
|---|---|---|---|---|---|---|
| Time Ave | Bias | RMS | ρ | σ | μSRB | Number |
| 3-hourly | 3.4 | 18.6 | 0.84 | 18.3 | 405.4 | 343510 |
| Daily | 3.4 | 13.8 | 0.91 | 13.3 | 405.4 | 43116 |
| 3-hourly monthly | 4.6 | 10.3 | 0.96 | 9.2 | 405.2 | 9047 |
| Monthly | 3.2 | 9.2 | 0.96 | 8.7 | 402.9 | 1393 |